Difference between revisions of "Interpersonal Relationships"
(Created page with "The future WFM standard proposes a new employee-first framework, where interpersonal relationships between WFM, Finance, HR, Contact Center management, executive leadership an...") |
(No difference)
|
Latest revision as of 12:54, 23 October 2024
The future WFM standard proposes a new employee-first framework, where interpersonal relationships between WFM, Finance, HR, Contact Center management, executive leadership and frontline employees are significantly enhanced. The framework views WFM in a new light, where employees are prioritized first and how automation and simulation technologies can be leveraged to benefit employees.
WFM’s direct involvement with employee satisfaction and retention will introduce a radically different interpersonal relationship between the Workforce Management team and WFM's primary customer, the frontline employee. Leveraging automation and simulation techniques, and taking an employee-first stance, this new standard will support achieving traditional goals with a bonus: solving the legacy contact center problem of high employee attrition.
While recognizing the unique challenges contact center employees face, this standard establishes a framework for open communications, feedback, creative contributions, transparency and trust to achieve the collective organizational goals. Before outlining how interpersonal relationships between WFM and frontline employees is addressed in this standard, we document some background topics, including the importance of customer service and unique challenges contact center employees face servicing customers over the phone.
Contents
[hide]Background
Importance of Customer Service: Service Profit Chain
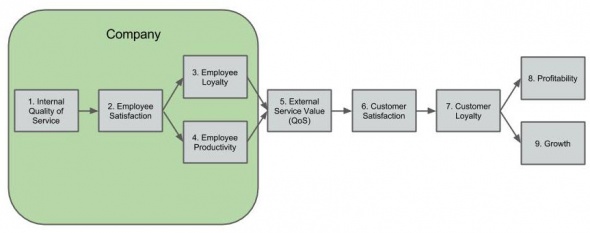
The term "customer service" can refer to a wide range of types of assistance provided by a company to those people who buy or use the company's products or services. Service can be automated, manual or some combination, and can be provided by machines, humans, or again, some combination of each. With the exception of products viewed as pure commodities, the quality and level of service expected can become a critical competitive differentiator for an organization. The importance of the quality of service is described in Putting the Service-Profit Chain to Work, originally published in 1994 by James L. Heskett, W. Earl Sasser, and Leonard Schlesinger;[1]"The service-profit chain establishes relationships between profitability, customer loyalty, and employee satisfaction, loyalty, and productivity. The links in the chain (which should be regarded as propositions) are as follows: Profit and growth are stimulated primarily by customer loyalty. Loyalty is a direct result of customer satisfaction. Satisfaction is largely influenced by the value of services provided to customers. Value is created by satisfied, loyal, and productive employees. Employee satisfaction, in turn, results primarily from high-quality support services and policies that enable employees to deliver results to customers. ."[2]Whether you are running a financial institution, a telecom, a small boutique clothing shop or restaurant, the Service-Profit model demonstrates the critical importance that customer satisfaction has on profitability and revenue growth. Further, it correlates satisfaction of your customers to the quality of service the provide, which in turn is drive directly by your employees' loyalty and productivity. Finally, those employee factors are directly related to employee satisfaction, driven by a host of internal quality factors. The Future WFM Operating Standard seeks to measure, monitor and positively influence the internal quality of service.
Contact Centers & Unique Challenges
Customer service comes with a wide range of expectations from both the customer's perspective and the employee's perspective. This standard recognizes that the stress and expectations that contact center employees experience make this specific type of customer service function among the most difficult in the industry. Job stress results in high employee turnover across the vast majority of contact center organizations, with these jobs typically experiencing 30-50% annual attrition, and often rates that can significantly exceed 50%.
To solve this legacy problem of high employee turnover, we must first understand the complex dynamics involved in the job. To do so, we first look at a range of customer service functions across different industries, to contrast contact center work from the rest of "customer service" from both the customer's perspective and the employees perspective.
Customer Perspective: Resolution Expectations & Transaction Predisposition
All customer service expectations are not created equal. Companies who have employees providing support services to their customers are exposed to a wide range of experiences for each interaction, and different levels of expectation when servicing the customer. To demonstrate the high degree of variability in customer service from the customer's perspective, we plot a range of customer service functions across two categories: resolution expectations & transaction predisposition.
Resolution Expectation
When we attempt to receive support on a product or service, customers all enter with an expectation of how long it will take to receive service and resolve our request. Time to resolution can be thought of as the elapsed time from when a customer requires service assistance to the time when that service request is completed. This time to resolution is viewed by two segments; the queue time to be "next" for service, and the time it takes to bring the service request to resolution, after you've reached your point in the queue. Examples of both in-person requests and phone requests demonstrating sample times experienced in both "queue time" and "time to completed service request":
| Type of Request | Time in Queue | Queue Time | Time to Completed Service | Time to Complete |
|---|---|---|---|---|
| Arrive at hotel & park car w/ valet parking | From the time you pull up to valet station to when you receive your valet ticket | 0 - 10 mins | Once a ticket is issued, your service is complete | 0 mins |
| Depart hotel, retrieve car from valet parking | Time standing in line to turn in your valet ticket | 0 - 10 mins | Your car is delivered | 5 - 30 mins |
| Get take-out from fast food drive-through | From the time you pull into line to when you place your order | 0 - 10 mins | Once you receive your order and drive away | 1 - 10 mins |
| Dining at fine restaurant | From the time you walk in the door until you are seated | 0 - 60 mins+ | Once you've completed your meal | 1 - 2 hours |
| Checking out at a grocery store | From the time you chose a cashier line to when the cashier starts processing your order | 0 - 10 mins | Once your groceries are bagged and you pay | 1 - 10 mins |
| Taking your car in for an oil change | From the time you drive up to the service bay until your oil change begins | 0 - 10 mins | Once your oil is changed, you pay and drive away | 10 mins to >1 hour |
| Taking your car in for a major repair | From the time you drive up to the service bay until your service advisor finishes collecting information | 0 - 20 mins+ | Once you have picked up your car, pay and drive away | hours to days |
| Having your clothes dry cleaned | From the time enter the dry cleaners to when you receive your ticket | 0 - 5 mins | Once your dry cleaning is completed | hours to days |
| Cashing a check at the bank | From the time you enter the bank until you reach a bank teller | 0 - 20 mins+ | Once the teller cashes your check | 1 - 10 mins |
| Checking your bag for an airline flight | From the time you walk up to the baggage check line to when you present your bag to the representative | 0 - 60 mins+ | You bags are weighed, ID validated and you receive your claim ticket | 1 - 10 mins |
| Phone: file a claim with your insurance company | From the time you call the insurance company to when you reach an agent | seconds to mins | Once your claim is processed and payment received | Days to weeks |
| Phone: Trouble with existing cable provider | From the time you call the cable company to when you reach an agent | seconds to mins | Once your trouble is resolved | Mins to Days |
| Phone: rebook a flight | From the time you call the airline company to when you reach an agent | seconds to mins | Once your flight is rebooked | Minutes to Hours |
| Phone: report a stolen credit card | From the time you call the credit card company to when you reach an agent | seconds to mins | Once your account is closed / or new card issued (*days on re-issue) | Minutes to Days* |
- to answer 90% of calls in 20 seconds or less
That same credit card company may have a different queue, for example one where a customer is wishing to dispute a charge. For this "less urgent" inquiry, the company may target:
- to answer 70% of calls in 30 seconds or less
When service level is being maintained, customers calling typical phone queues will generally spend "seconds to a few minutes" in queue waiting to reach a contact center agent. Of course, with periods of excess demand and/or short supply of agents, this time in queue can quickly grow to many minutes, up to hours. As time in a phone queue begins to lengthen (queues grow from 15 mins, to 30 mins to 1 hour or more) a majority of customers will abandon that queue and either try back later or attempt an alternative service channel.
Transaction Predisposition
A variety of customer service resolution expectations are outlined above. Those transaction types can be further expressed by how a customer is entering into the engagement. Unfortunately, contact centers skew to have a predisposition where they enter the interaction negatively when compared to receiving service at a fine restaurant or a valet taking your car off to be parked. No one calls their telecom provider, their insurance company, or the airline they just flew to compliment the service agent on what a wonderful product or service the company offers. Of course, a customer may compliment the experience they had with the agent servicing the call, but the vast majority of calls placed to contact centers start because:
- Customers are have having a problem or are dissatisfied with a product or service
- Customers are looking for an exception, refund or relief from the product or service
- Customers are having trouble resolving issue from an alternative channel (or chose not to engage with alternative channel)
Another segment may enter with a more neutral disposition:
- Customers need a change to an existing product or service
- Customers may be seeking more information to purchase a product or service
Customer Service Functions Graphed
Now, when we graph a wide variety of customer service jobs, we see how:
- Contact center employees face customers with a high expectation of time spent (minimal time in queue w/ rapid issue resolution), and
- Contact center employees face a continuous stream of negative and/or neutral interactions (customers are not calling a contact center to praise a company)
The net effect is that these lead to increasing levels of stress.
The High Cost of Employee Attrition
The costs for replacing contact center employees is little understood and often significantly underestimated. Within the Future WFM model, we seek to expose these costs, and leverage models to dynamically calculate them.
- To calculate the high cost of employee attrition, we begin with a simple demand calculation.
- We then calculate the associated speed to proficiency curve.
- After understanding demand and speed to proficiency, we incorporate:
With the model constructed, we then output a base required FTE leveraging the simple demand calculation, and a total required FTE, to represent the additional FTE needed due to turnover. The total required FTE due to attrition is often underestimated, thought of (incorrectly) as simply by taking your annual attrition rate X your base required FTE and factoring in the Length of Training.
In many instances, due to the speed to proficiency curve and associated onboarding costs, the actual cost of attrition can be 2-4x higher then expected.
Traditional WFM Relationships
WFM and Frontline Employees
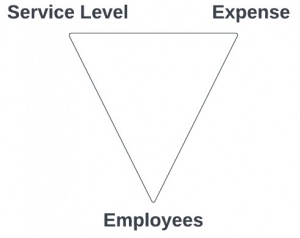
Workforce management teams have traditionally engaged with frontline employees under a prioritization model where the top two priorities were:
- Service Level Achievement
- Optimized Staff for Expense/Budget Achievement
With this model, frontline agents were always third in line after service level and expense. Legacy WFM processes reinforce this prioritization framework, with many processes designed to balance service level and financial results, often at the expense of the frontline agent. The goals, roles and legacy processes left WFM teams and frontline employees with a contentious relationship. The legacy approach did not lend to supporting agent retention, and in some cases may have contributed to attrition.
WFM and Finance
In contrast to frontline employees, many legacy WFM teams have solid relationships with their finance counterparts. Finance recognizes the WFM team's mission to reign in costs by a continuous focus on optimizing the business. WFM teams have insight into the trends, which factors are driving variance to budget, and can be consulted by finance teams as to the feasibility and options to drive financial outcomes in a certain direction.
Finance teams often must explain variance between forecast and actual financial results, and often will rely on WFM teams to conduct variance analysis to isolate the components leading to variance. Almost always, variance can not be addressed adequately by examining demand (call) variance alone.
Because of the alignment between the goals of legacy WFM teams and finance, these teams traditionally have strong relationships.
WFM and Senior Leadership
Again, in contrast to the potentially contentious relationship with frontline employees, many legacy WFM teams have solid relationships with their senior leadership. Similar to finance, WFM can provide guidance as to the feasibility and options to drive financial outcomes in a certain direction. But in addition, senior leaders are always concerned about achieving service level results, and look to the WFM team for answers, especially when service level is in distress.
WFM teams also provide the mechanics for establishing budgets by providing insight into the levers that balance service level and expense. Finally, senior leadership may look to the WFM team for a second opinion when interrogating their own middle management on why either service level and/or expense targets are in jeopardy.
There are limitations; senior leaders may request outcomes not support by the WFM math. For example, leadership may seek a financial outcome that is in direct conflict with the staffing levels needed to service the forecasted demand while delivering service level objectives. In such, depending on the senior leaderships understanding of the core math behind contact centers, WFM may struggle with senior leadership relationships.
Next Generation Workforce Management Relationships
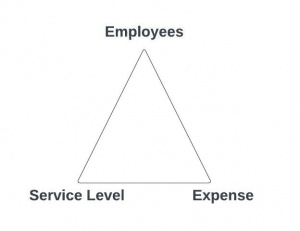
Stated throughout this standard, the next generation WFM operating standard stresses the importance of an employee-first mindset. In the simplest representation, the model which priorities service level and expense over employees is inverted, where the impact on employees is considered first. This does not imply all employee's wishes are to be met while negatively impacting service level and/or expense. Instead, it implies we examine all decisions through the eyes of the employee first, considering the impact to the employee, and then determine the downstream impact to service level and expense.
This approach can be done independent of which next generation processes you have implemented, however, executing most employee-first scenarios requires adoption of two key processes: The implementation Resilient Capacity Planning and Intelligent Automation.
WFM and Frontline Employees
Once positioned with an employee first mindset, this standard seeks to change interpersonal relationships with frontline agents to one where the frontline employee feels that WFM is working to enhance elements that lead to higher employee satisfaction. Again, referencing the importance of the quality of service is described in Putting the Service-Profit Chain to Work, WFM seeks to influence the internal quality of the frontline employee's job.
To do so, we examine how our processes in the Future WFM Operating Standard influences the employee. Many models exist which can aid mapping WFM activities back to how we can influence the quality of the frontline employee's job. This standard leverages three components;
- The Workplace Resilience Study from the ADP Research
- The Happiness Model by Nic Marks leveraged at Friday Pulse.
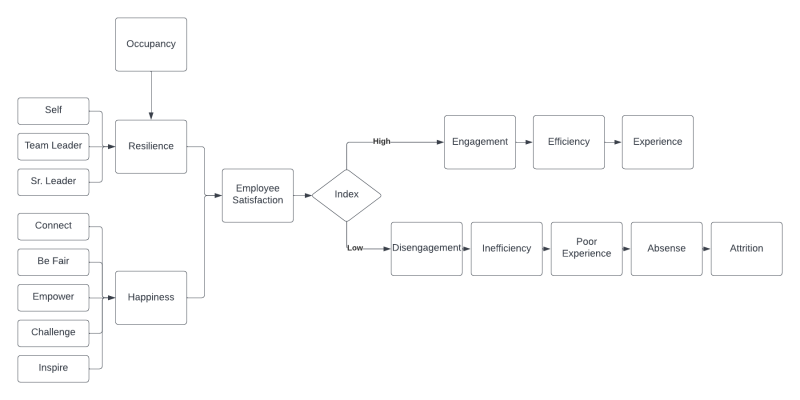
By examining these frameworks, we seek to understand components which lead to 1) greater employee resilience, and 2) greater employee satisfaction. By understanding this, we can then map activities WFM processes which lead to greater resilience and satisfaction. When taken together, greater employee resilience and greater job satisfaction / happiness leads to increased employee satisfaction, which in turn leads to positively impacting:
- Employee Engagement
- Employee Efficiency
- Employee & Customer Experience
- Employee Retention
Ultimately, the activity of mapping our relationship and processes with the employee first mindset is to drive higher engagement, efficiency and experience, and to retain talent, having a direct impact on costly employee turnover.
The American Workforce Index
Populace.org is a non-partisan think tank dedicated to building a world where all people have the chance to live fulfilling lives in a thriving society. Populace leverages a survey process called "private opinion methods" in the organization's research efforts. The methodology helps expose people's private views free from distorting factors like public opinion and social pressures. As a result, Populace produces studies where we see what people want vs. what we all think people want, something Todd Rose references as "Collective Illusions."
Relevant to our next generation of standards at WFM Labs, we leverage the research study by Populace: The American Workforce Index: Perspectives and Priorities. Findings from their survey study conducted in 2021 have meaningful insights on how we view next-generation WFM processes. Three key findings deal with:
- Workplace Flexibility
- Respectful, Inclusive Workplace
- Trust
- Job Practicality & Job Purpose - Equally Important
These findings challenge legacy WFM practices, including traditional shift-bid practices, adherence to schedule measurements, and arcane approval processes that deteriorate the notions of flexibility and trust.
In crafting company specific processes that directly impact frontline agents, company specific standards should test the proposed process against the findings in this study.
Workplace Resilience Model
As outlined earlier, the job function of a customer service agent has a high degree of stress associated with the role. For this reason, an employee's resilience is an important component consider as we seek to influence engagement, efficiency, experience and retention. The Workplace Resilience Study | 2020 by ADP Research Institute[4] provides a framework for understanding what leads to greater employee resilience."Much academic research has been conducted on resilience. While researchers have not settled on a single definition, there are common threads. It has been defined as “the ability to maintain or regain mental health after experiencing stress and adversity” (e.g., Herrman et al., 2011), “the relative capacity for healthy adaptation to life adversities” (e.g., Sahi & Raghavi, 2016) and “the ability of individuals to successfully function despite significant life adversities” (e.g., Werner & Smith, 1982; Rutter, 1987; Scoloveno, 2017). What these definitions have in common is a person’s ability to respond to (and “bounce back” from) adversity."[5]The study goes on to create a definition which blends elements from previous studies:
"We define Workplace Resilience as: the capacity of an individual to withstand, bounce back from, and work through challenging circumstances or events at work."[5]
Resilience is not a characteristic that you have or don't have; it's a set of personal traits and abilities, but traits and abilities shaped through our own life experiences. By examining this study, WFM teams can examine how it can influence employee resilience.
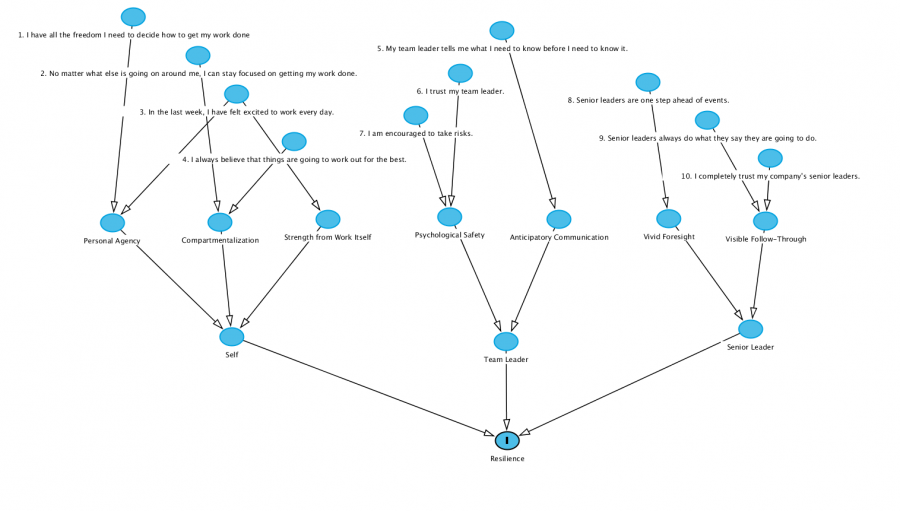
The work by ADP Research Institute goes on to outline that resilience in the workplace has three components; Self, Team Leader, and Senior Leader. In "Self" the studies describes 4 categories; personal agency, compartmentalization and strength from work itself. In "Team Leader" the study examines Psychological Safety and Anticipatory Communications on impacting resilience. Finally, "Senior Leader" describes Vivid Foresight and Visible Follow-Through as elements impacting resilience.
Happiness Model
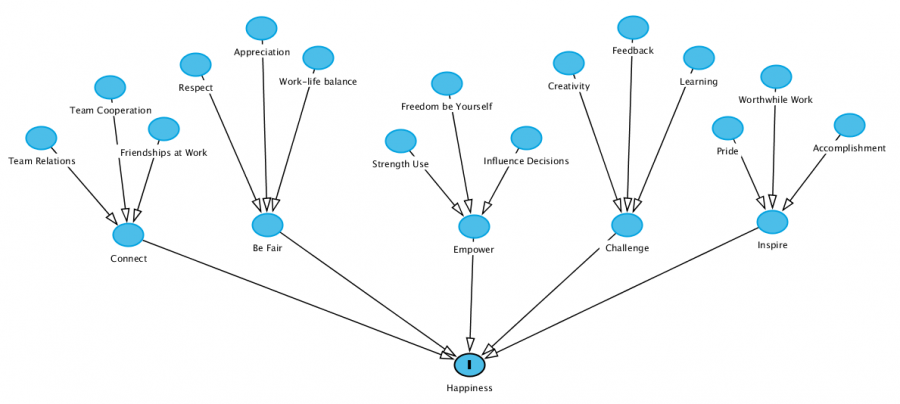
Nic Marks leverages an easy to understand Happiness model through Friday Pulse. This model has direct application to the Future WFM Operating Standard. By examining the model, WFM can map processes and activities back to support areas that lead to greater employee satisfaction. This model aggregates Happiness at Work scores be examining 5 areas:
- Connect
- Be Fair
- Empower
- Challenge
- Inspire
The model further breaks down each of the five categories as illustrated in the diagram. Example, team relations, team co-operation and friendships at work all feed into "Connect". Respect, appreciation and work-life balance feed "Be fair". Use of personal strengths, the freedom to be yourself, and being able to influence decisions feed "Empower". Creativity, feedback and learning feed "Challenge". And finally, pride, worthwhile work, and a sense of accomplishment feed "Inspire"
When we map measurements for each, we can score an employee's happiness at work.
While companies generally conduct annual or semi-annual employee surveys for "employee satisfaction" - these are point-in-time measures neglect to recognize the fluid nature of our well-being at work. By collecting data on this model at points in time, we can begin to augment models geared toward reducing employee attrition.
Contact Center Breaks and Occupancy Model
While leveraging the resilience model and happiness model, the standard incorporates a final element experienced in contact centers, occupancy. Occupancy is introduced as its own variable, although it could also be though as an extension of "be fair" or "challenge" in the happiness model. Due to the importance of the correct levels of occupancy, we isolate it as to call special attention to how maintaining the right occupancy has an impact on employee satisfaction, filtered through an employee's resilience:
Leveraging Microsoft's Worklab: Research Proves Your Brain Needs Breaks[6] - we have compelling evidence which demonstrates how the brain works differently when you take breaks between calls. This study examined back-to-back video conference calls with no breaks vs. 10 minute breaks w/ meditation between calls, and finds:
- Breaks between meetings allow the brain to “reset,” reducing a cumulative buildup of stress across meetings.
- Back-to-back meetings can decrease your ability to focus and engage.
- Transitioning between meetings can be a source of high stress.[6]
While applied to meetings, this standard applies these same findings to the new WFM Operating Model, and looks at new techniques to ensure even when service level is deteriorated, that front line agents are introduced with micro-breaks, an automated process to inject sufficient time to allow the brain to reset. Without microbreaks, sustained back-to-back calls lead to higher levels of stress, and negatively impact engagement, efficiency and experience. Over longer periods of repeated high occupancy periods, the stress accumulates, and leads to agent burn-out, absence, disability and ultimately attrition.
WFM Approach
Leveraging these two models, WFM can prioritize activities that impacts the models outlined above.
- Coaching and connection time between frontline agent and supervisor
- Delivery of employee development time (product, compliance, refresher, certification training)
- Delivery of communications (product updates, success stories, urgent communications, safety reminders)
- Delivery of activities (surveys, quality evaluations, recognitions, bonus breaks)
- In-call and after call support for challenging long calls
- Wellness breaks: preventing agent burn-out from sustained back-to-back calls
- Dynamic schedule flexibility( voluntary time off or overtime, break, lunch and end-of shift adjustments)
(In progress below - mapping resilience, happiness and occupancy back to end metric of attrition)
Resilience Model
Happiness Model
References
- Jump up ↑ James L. Heskett, W. Earl Sasser, Leonard Schlesinger The Service Profit Chain: How Leading Companies Link Profit and Growth to Loyalty, Satisfaction, and Value. New York: The Free Press, 1997.
- Jump up ↑ Except from HBR article republished July, 2008:https://hbr.org/2008/07/putting-the-service-profit-chain-to-work
- Jump up ↑ https://www.adpri.org/assets/workplace-resilience-study/
- Jump up ↑ Workplace Resilience Study | 2020 by ADP Research Institute
- ↑ Jump up to: 5.0 5.1 page 4, The Workplace Resilience Study | 2020 by ADP Research Institute
- ↑ Jump up to: 6.0 6.1 Microsoft: Research Proves Your Brain Needs Breaks
![[3]Transaction predisposition vs. resolution expectations](/tedswiki/images/thumb/d/d0/Plotting_practice_%281%29.png/600px-Plotting_practice_%281%29.png)
