Service Level, Abandon and ASA Relationship Study
Contents
[hide]ASA, ABA or SL: Service Level!
Service level is the best call center telephone speed-to-answer measure.
It directly measures the accessibility of our company to our customers and should be used as the primary measure of success with relationship to workforce management planning. (defined as above, answering X percent of calls within Y seconds). Service level is the tried-and-true indicator for call centers and is the basis on which all workforce management systems are built. Service Level should be one KPI out of a suite to indicate the performance of a call center, along with First Call Resolution and a Quality Metric, such as Voice of the Customer.
While service level is often viewed simply as a performance measure or goal for call centers, a call center's service level objective provides the foundation for the most fundamental activities in a center: planning, staffing and execution. The service level objective chosen will directly influence the number of people we hire, how many people we need to have on the phone in each hour of the day and when we need to implement a real-time recovery plan.
While SL is the best call center metric to judge speed-to-answer results, ASA and ABA studies will provide additional insight into tolerance of customers to potentially wait longer. Looking at Service level, ASA and ABA in combination is required when examining business cases for offering a differentiated level of service to customers.
Factors of Caller Tolerance
The most direct relationship to how many callers abandon a queue is simply how long they're expected to wait. Many additional factors play into their tolerance to wait (described below as 7 factors) - but the most critical factor is simply how quickly the caller is being served.
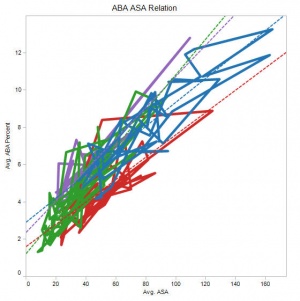
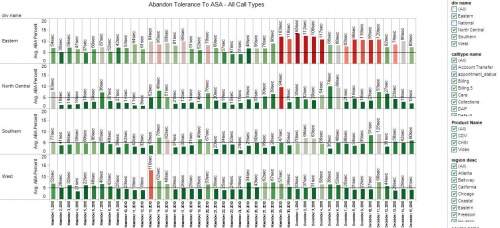
To examine the current relationship between service level, ASA and abandon, we've plotted data from call centers and created a model to allow various filters to this data to be applied:
This model can be viewed live here with the ability to filter direct.
Expressing SL to ABA Relationship
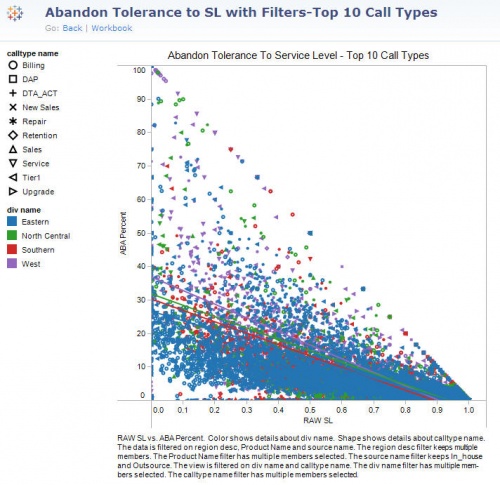
Another view of this data is to take and plot call abandon percentages against raw service level to determine the equation of the line that best fits the relationship between the two variables. Again, below is the model created:
This model can be viewed live here with the ability to filter direct. NOTE: Filters have been placed to discover 10 ten call types in this model.
4 different equations, plus a composite for all 4 Divisions. For Nov 1st - Dec 15th, these equations for relation between SL and ABA are described here:
Best Line described by top 10 call types, all divisions, Nov 1 - Dec 15
- ALL < 0.0001 ABA Percent = -33.416*RAW SL + 30.5224
- West < 0.0001 ABA Percent = -40.7311*RAW SL + 36.9135
- South < 0.0001 ABA Percent = -34.0426*RAW SL + 30.3213
- NCD < 0.0001 ABA Percent = -33.9794*RAW SL + 31.8416
- East < 0.0001 ABA Percent = -28.5318*RAW SL + 26.6711
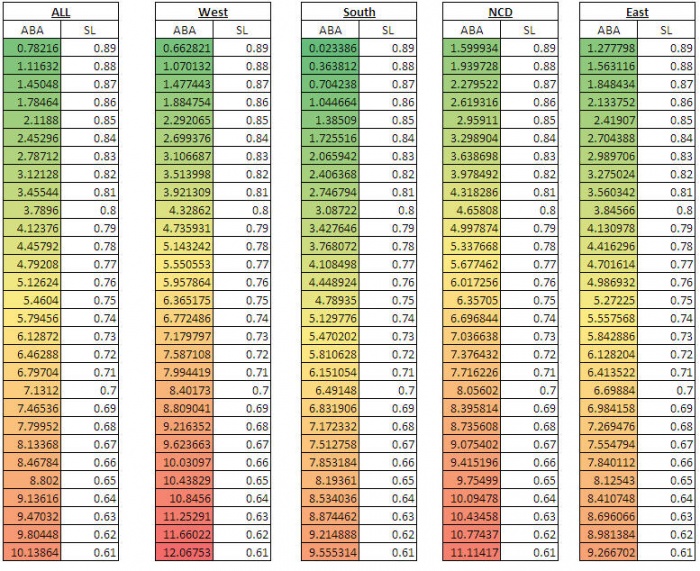
Below, we see the relationship between SL and ABA when comparing across Divisions. As expected, in West, where SL is delivered at a higher rate, more consistently, there is a lower tolerance for when SL begins to drop:
Seven Factors of Caller Tolerance
There are seven factors published by ICMI:
There are seven factors that affect caller tolerance. They influence everything from how long callers will wait in queue to how many will abandon, how many will retry if they get busy signals, and how they will react to automation, such as an interactive voice response (IVR) system. These factors, identified by ICMI research almost two decades ago, also affect how callers perceive the service the call center is providing.
Degree of Motivation
Motivation for the call. How important is the call to callers? What are the consequences to them of not getting through? How badly do they need or want the product or service? Callers waiting to get hospital authorization will normally wait longer than a medical aid caller inquiring about a benefits program the medical aid is running.
Availability of Substitutes
Substitution options. Even though they are highly motivated to make the call, callers who encounter difficulties may abandon if there is another way to satisfy their need. If callers are highly motivated and have no substitutes, they will be willing (but not necessarily happy) to wait longer. Even though they do not drop the call, they still might be very unhappy about the poor service.
Competition’s Service Level
Competition’s level of service. If it’s easier for callers to use competitive services or if they have a tough time reaching you, they may go elsewhere. This is obviously highly dependent on the service being offered and the ease of changing between service providers.
Level of Expectations
Expected service level. The experiences callers have had with the call center and the reputation that the organization has in the market place have a direct bearing on tolerance. In addition, any experience that a customer has had with another organization (positive or negative) has a direct impact on their tolerance levels with your organization
Time Available
Available time. How much time do callers have to accomplish the call? Highly stressed business people would have very little patience calling a Government call center to report a missing statement, while retirees calling the same call center may have more time or inclination to talk. Customers using mobile phones are also less likely to want to wait for long periods of time as they are normally on-the-go.
Who’s paying for the call?
Who’s paying for the call? Callers are usually more tolerant when they are not paying for the call. In many cases, this is not the substantial issue it used to be when long-distance rates were more expensive.
Human Behavior
Human behavior. Any external factor that may influence the customers mood has an impact on the customers tolerance during a call
Service Level: IVR Inflated
As of EOY 2010, Service Level was viewed as a critical KPI for the performance of call centers. This calculation is determined in a way which differs from how most organizations view SL. Traditional SL calculations are created using the number of calls answered in under X seconds / total calls offered agents. For a 30 second goal, you calculate SL as such:
- Service Level = (Total calls answered in 30 seconds / Total calls offered to agents)
The organization's measurement artificially inflates service level by adding in calls handled by the IVR, as though these customers were actually serviced in SL. This can dramatically cloud the actual results by indicating SL is higher than what customers are experiencing, and hence, drive higher levels of abandon rates than the company may wish to tolerate. High abandons lead to repeated attempts into the call center, which lead to poor customer experience.
Recommendation #1: Change to Traditional SL Calculation
Since the current method of calculating SL overstates our actual performance, it is covering what are significant misses against what a customer experience should involve.
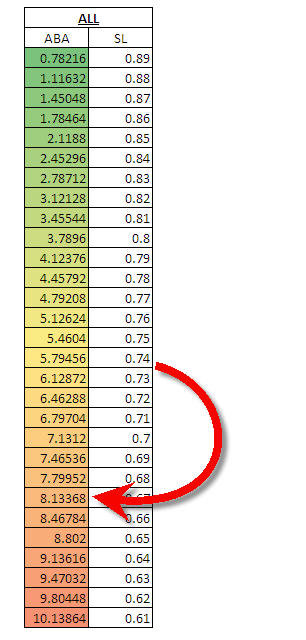
As diagrammed to the right, on a day where we perform "OK" with mid-70's SL, we're likely sustaining abandon rates at 8% composite, and most likely abandon rates >10% in service queues.
To expose the true performance of service level, all IVR calculations should be removed from the reporting of call center service level queue performance.
Recommendation #2: Staff Queues To Minimize ABA < 5%
Unless specifically targeted for a lower SL delivery, all queues should work with SL objectives to minimize abandon rates to less than 5%, ideally targeting a range of 3% to 5%. Driving SL's high enough to sustain abandons at an agent level of lower than 3% is not practical. At the same time, abandon rates at an agent level higher than 5% on a regular basis has a significant impact to customer experience.
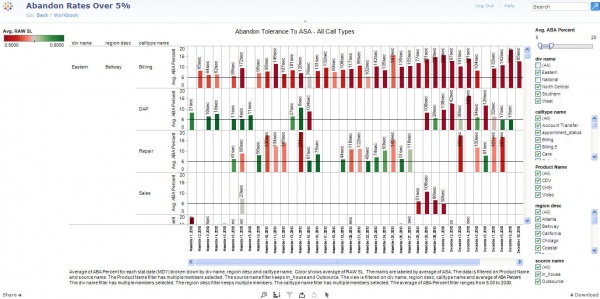
As illustrated below, between Nov 1st and Dec 15th, 2010, we were operating ~25% of these days with abandon rates higher than 5%, and >11% of theses days with abandon rates over 10%. These are daily results aggregated by region, by call type, with just the top 10 call types examined.
This model can be viewed live here with the ability to filter direct on ABA rates, and examine which combination of regions and call types fit the criteria.
