Gating Strategy & ASA ABA Relationship Study
Contents
[hide]Example - EOY2010
“Outages & other un-expected incidents have the ability to cause wide-spread impact to agent / technology resources”
Challenges
- Due to the nature of the Cable/Communications business & the volatility of voice traffic during outages the company will never have enough agent capacity to handle large outages.
- There are currently no documented standards surrounding enterprise telephony capacity & network capacity management today from a Care perspective, when hold times & AHT go up due to issues with the business outage or other trunk capacity often fills up resulting in busy signals .
- Without a protection strategy these all trunks busy events impact all groups which leverage the common technology. Idle resources / in retention / sales or other groups are left with traffic being unable to reach them due to congestion from repair/billing queues.
- NETO/IT teams need to be provided accurate agent forecast so they may adequately plan and build the appropriate capacity in all areas. Once the agreed upon capacity is in place they should be monitoring the health of all points of presence and ensuring max availability / growth with standards
Proposal
Technology capacity constraints should not dictate customer experience - business rules should. While the ROCs continue to build standards to leverage multiple lines of defense to message customers when an outage occurs, it is still necessary to protect resources with business rules. The solution proposed to minimize disruption to customers calling during a crisis event involves a series of deflection and barge-in messaging tactics to minimize the need to trigger the last line of defense, gating customers out of specific queues.
Since the best way to gate a customer is dynamic, by queue, by Estimated Wait Time (EWT), the business question must be asked;
- What is the "correct" wait time to disconnect a customer from a queue, after all lines of defense have been exhausted?
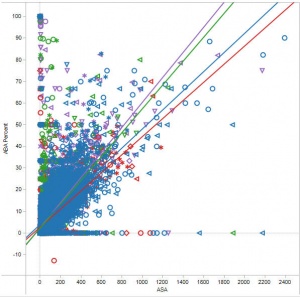
In order to answer this, we look toward the relationships currently experiences today. The best line to fit that relationship when viewing the top 10 call types across the enterprise is described as:
- ABA Percent = 0.0483983*ASA + 2.80902
Full Model Viewed Here
This line varies by Division, as tolerance varies. More about this relationship can be viewed on the Service Level, Abandon and ASA Relationship Study
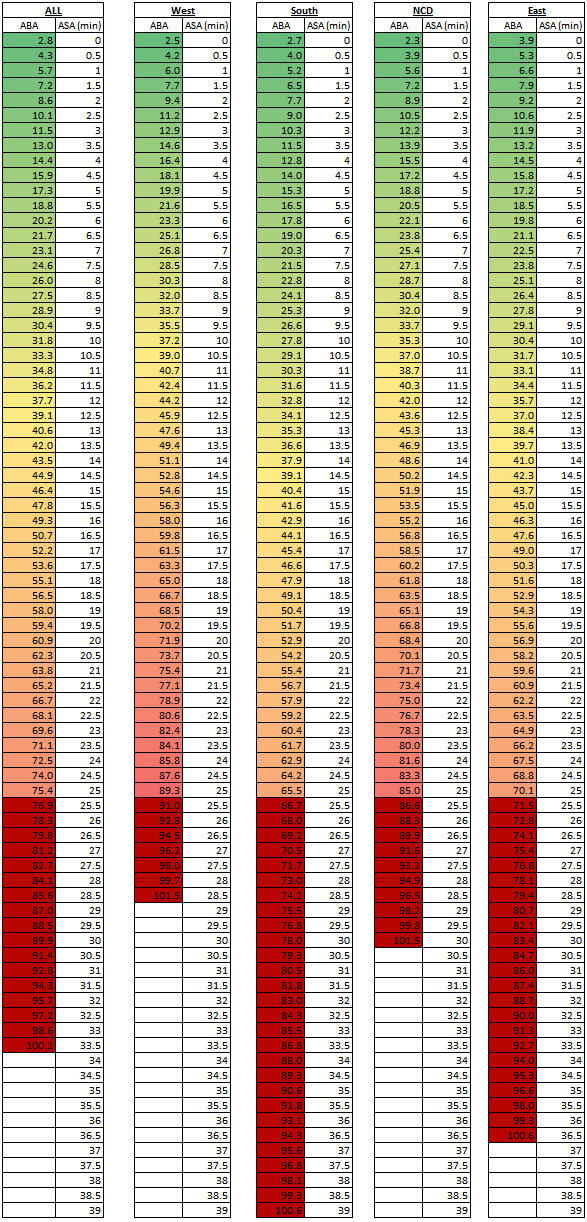
Best Line describing long ASA to ABA by top 10 call types, all divisions, Nov 1 - Dec 15
- ALL < 0.0001 ABA Percent = 0.0483983*ASA + 2.80902
- West < 0.0001 ABA Percent = 0.0578706*ASA + 2.49169
- South < 0.0001 ABA Percent = 0.0418242*ASA + 2.72182
- NCD < 0.0001 ABA Percent = 0.0551182*ASA + 2.27683
- East < 0.0001 ABA Percent = 0.0441465*ASA + 3.92985
This line is best visualized by placing data into the equations:
Based on the data above, we propose the business rule of 25 mins EWT by a specific queue to enable the last line of defense.
Standards
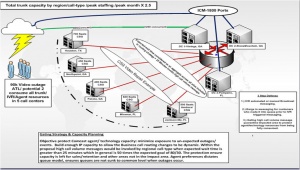
- Telecom- Obtain 6 month Regional peak forecast from ROC by call-type, use forecasted numbers X 2.5 to determine inbound trunk capacity needed. Overlay customer facing numbering strategy document to break up capacity into appropriate categories.
- Toll-free 1-800
- Local Dial (404-)
- Local (TDM or SIP)
- Network -Provide network team peak forecast by call center using peak seat capacity guidelines under DR situation. Separate sites into different categories based off risk exposure to ensure proper redundancy model include outsource partners in evaluation.
- Data Centers - Critical
- > 150 Seats- High
- < 100 - Medium
- < 50 – Low
3-Step Defense - ATL Video Outage Example
Gating strategy is build on 3 levels of defense:
- Deflection messaging: Automated IVR through correlation, threshold messaging and manual messaging, all 1st line of defense
- Barge-In messaging: When outages occur, callers getting into queue are played a message while on hold, attempting to clear queues
- Disconnection: Last line of defense, is playing message for high call volumes and not presenting the caller to queue, to protect resources (primarily protecting ACD from absorbing all capacity and blocking potential sales, retention, billing calls)
From the data below we can see that the gating strategy protected all of the IVR and shared trunk ports from being consumed prior to the outage messaging being active, had the protection not been in place this event would have likely impacted all regions in Central . Even with the protection Atlanta still had 800+ calls in queue as an aggregate to reach the EWT > 25 threshold. Once the Barge in message was placed most callers chose to hang-up on their own.
As you can see from stats from 11AM on the number of callers who were played the high call-volume message and not allowed in queue continued to decline.
As we detect outages quicker with the IVR gating will continue to play less of role , the logic should continue to exist as last line of defense. Also worth mentioning that the agent preferencing by region calls allowed Houston, SFL, Jacksonville to continue to help Atlanta but they maintained their own regional service level throughout the event.
Objectives
Routing
Build a dynamic routing strategy that if flexible & self protecting by using agent preferencing we are able to pool resources while still protecting from regional events. Differences in agent skill sets often make this attractive for call sharing.
Reporting
By instituting the gating rules that invoke high call volume thresholds within the ACD application, all of this data can be exposed to real-dash and forecasting tools within the ROC monitoring. Generally this data has to come from IT or technology teams ATB reports or other.
Capacity Planning
Technology teams are often held responsible for capacity issues outside of their control, instead they should be accountable for ensuring the agreed upon capacity is up & growing with overall staffing trends provided by the ROC(s).


