Difference between revisions of "Cost Improvement Programs"
(→Solutions) |
|||
| Line 108: | Line 108: | ||
The ADS rollout is complete for Broward and 49k boxes remain for Dade. Additionally, the recent VOD system replacement has understandably resulted in call creation in the short term. Both systems have implemented the Refer to Maintenance process, allowing visibility be CAEs of any open service ticket. | The ADS rollout is complete for Broward and 49k boxes remain for Dade. Additionally, the recent VOD system replacement has understandably resulted in call creation in the short term. Both systems have implemented the Refer to Maintenance process, allowing visibility be CAEs of any open service ticket. | ||
| − | 'Next Job/ETA:' The “Where’s My Tech” volume can be addressed with improved technician coding of ETAs on their handhelds. (Dade is in the mid 60% and Broward is in the 40% range on ETAs daily). For installation work, however, the contractors are not using WFX. Contract labor strategy should address this issue. | + | '''Next Job/ETA:''' The “Where’s My Tech” volume can be addressed with improved technician coding of ETAs on their handhelds. (Dade is in the mid 60% and Broward is in the 40% range on ETAs daily). For installation work, however, the contractors are not using WFX. Contract labor strategy should address this issue. |
'Pre-Repair Calls:' The recommendation has been made to utilize Universal Electronics Active Support Center to make outbound pre-repair calls. In addition to accumulating useable data on avoidable trouble calls which can be used for CAE coaching and trouble shooting training, UEI will resolve service calls by phone, resulting in an 18-20% reduction is truck rolls while the implementation of the various other projects noted here can be deployed. | 'Pre-Repair Calls:' The recommendation has been made to utilize Universal Electronics Active Support Center to make outbound pre-repair calls. In addition to accumulating useable data on avoidable trouble calls which can be used for CAE coaching and trouble shooting training, UEI will resolve service calls by phone, resulting in an 18-20% reduction is truck rolls while the implementation of the various other projects noted here can be deployed. | ||
| Line 116: | Line 116: | ||
Cross-Department Communications: The call center and fulfillment organizations reside in independent silos and do not view theirs as a partnership. Ideas should be explored that build bridges between the two organizations which facilitate real-time communication flow that allows the customer to be better served. | Cross-Department Communications: The call center and fulfillment organizations reside in independent silos and do not view theirs as a partnership. Ideas should be explored that build bridges between the two organizations which facilitate real-time communication flow that allows the customer to be better served. | ||
| − | Launch of Minuteman Activation Phase 1.0: In-house technicians will be provided the device health check and improved equipment activation flow through. Continued improvement in all technician’s equipment provisioning via their Symbol device (snapshot is 16% in Dade and 19% in Broward) will free dispatch time for other business process improvements. | + | Launch of Minuteman Activation Phase 1.0: In-house technicians will be provided the device health check and improved equipment activation flow through. Continued improvement in all technician’s equipment provisioning via their Symbol device (snapshot is 16% in Dade and 19% in Broward) will free dispatch time for other business process improvements. |
| − | + | ||
==Business Process Audit== | ==Business Process Audit== | ||
==Communications== | ==Communications== | ||
Revision as of 16:23, 16 July 2016
Contents
[hide]Cost Improvement Programs
Workforce Management organizations often are leveraged for establishing baseline metrics within a contact center and validating whether identified cost or metric improvement initiatives have yielded improvements in contact center operations. While 1:1 correlations are not always feasible, changes that are implemented and properly base-lined can be examined by a WFM organization to evaluate whether volumes, handle-time, shrinkage, or occupancy have changed as the result of that activity.
Below is a sample real-life contact rate reduction plan. In this plan, WFM would support validations of various segments.
Executive Summary
South Florida Region is currently experiencing a customer contact rate outside of normal operational goals and expectations. In order to determine the primary drivers contributing to the high contact rate, the Southern Division Customer Care and Technical Operations support team has launched a project to analyze all potential contributing factors. The project began with 3 weeks spent on-site in Florida, reviewing daily operations in both the call center and the field. This report outlines the initial observations, and recommends initiating a series of projects specifically designed to reduce contact rate within the call center.
Methodology
The methodology used to examine contact rate drivers approaches the business from multiple vantage points. Live and historical data collection, live customer care interactions and direct feedback from front-line representatives and management contributed to the core findings included in this report. The activities conducted to derive the initial findings included:
- Call Monitoring Sessions
- Workforce Management Interviews
- Supervisor Focus Group
- CAE Focus Group
- Resolve Ticket Analysis
- Traffic Analysis (Live and Historical)
- Analysis of Avaya VDN and Skill Structure
- Outbound Repeat Caller Program (National Team)
No Single Cause
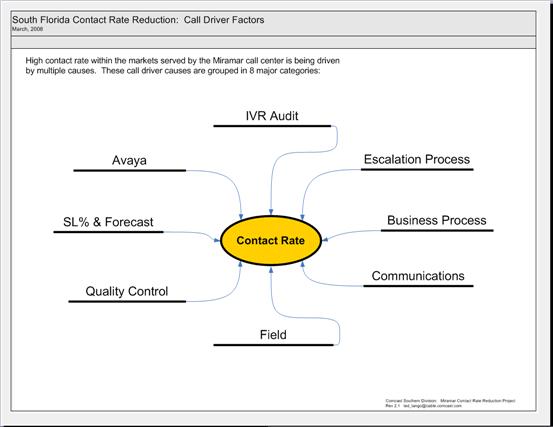
All observations and studies to this point suggest that there are at least 8 major contributing factors driving an increased contact rate. A critical observation; higher contact rate within the markets served by the Miramar call center is being driven by multiple causes. Contact rate solutions will require multiple initiatives, some of which will require significant change and investment in the operational environment. The 8 major call driver factors identified in this report include:
Avaya Call Routing & Skills
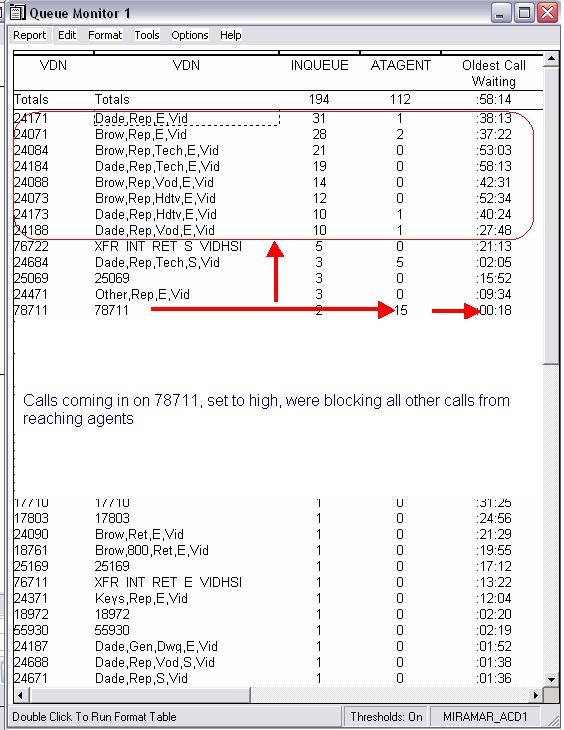
Finding: Avaya Structure Suspect – Analysis of the Avaya call routing structure, vectors, VDNs and skill design indicate a significant opportunity to improve call routing, and potentially directly lower contact rate. 2000+ VDNs feed over 100 active skills which lack a uniform method for accounting for call volume. Currently, the call center business is managed by altering VDNs and Vectors in a live environment, which introduces the potential for creating errors in call routing. An example of such an error was logged on March 3rd, when a return path VDN & Vector from an outsourcer, designed to hand calls back into the call center, was built with a vector that was set as “high” priority. This caused calls to flow freely from the outsourced vendor, but because of the large inbound volume, it at the same time created a call blocking situation:
By making changes within the routing structure, the opportunity for creating such situations is greatly increased. Additionally, opportunities exist for improving efficiencies by consolidating and standardizing call buckets and skills. Lack of standardized call types leads to changes made in routing, which can potentially bucket calls differently from one month to the next, providing challenges to WFM and forecasting. The largest portion of calls is currently classified as “General”, which requires mapping into a skill which more specifically defines the nature of the call type. While some transfer skills were recently built, transferred calls do not appear to be captured consistently by designating skills specifically for transfers, leading to exposure for increased contact rate from double counting calls. Steps should be taken to standardize and clean all existing routing within the Avaya; calculating an accurate contact rate will be the primary metric used to measure the impact made from other project recommendations. Solution: Avaya Standardization – A standardization project has been initiated, with the first operational review workshop held in Miramar March 18th- 20th. This workshop established the foundation for the redesign and standardization of call routing and skills, which will be implemented within approximately 4-6 weeks. See the timeline (Appendix D) for additional details associated with the Avaya project. Phase I project.
SL% Challenge, Forecasting and Staffing Models
Finding: Service Level Misses and Abandon Rate Impacting Overall Forecasting and Staffing Models
In conjunction with the Avaya finding, the WFM team’s ability to accurately forecast and staff to volume is confined by inconsistent data provided from the Avaya and is exacerbated by the high abandon rate / low service level challenges. Continuously missing service level not only impacts eWFM’s forecasting accuracy, but also impairs the call center’s ability to deliver superior quality of service. Supervisors are restricted in their ability to coach and develop CAEs, and the call center experiences higher rates of employee turn-over as a result.
Solution: Call Volume Relief & Re-forecasting
An immediate recommendation would include identifying additional calls which can be outsourced in the short-term, so that service level can be met. The call center is currently pursuing a strategy to isolate and outsource non-pay callers. Immediately following the Avaya re-design, additional call types will be able to be isolated for outsourcing. As call standardization is completed, and service level is met, WFM should begin to re-forecast volumes and create new shift bids as needed to match arrival patterns. As volumes stabilize with an acceptable service level, baselines can be established for measuring impact to contact rate through the deployment of additional projects identified. Phase I & II Project (Re-forecast requires Avaya standardization completion)
Quality Control
Finding: Absence of Independent Quality Control Driving Contact Rate
Observations from all data points: live monitoring, escalation ticket reviews, observations in the field with tech ops and the fulfillment centers as well as interactions with CAEs and Supervisors indicate that the absence of an independent quality control group within the call center is a leading cause driving higher contact rate.
Feedback provided directly from both CAEs and Supervisors indicate a desire for quality control within the environment. Supervisors listed the absence of time required for substantive coaching, combined with the absence of a quality group as the most common dislike about their job. All supervisors interviewed expressed a desire to have additional support for quality monitoring.
While the Avaya call routing project and abandon reduction (hitting SL) offer significant contact rate reduction potential, the most significant opportunity for reducing contact rate throughout the call center will be the successful implementation of an independent quality control group within the contact center. While quality monitoring is tasked between supervisors, managers, and workforce management, these activities are not sufficient to identify and fix quality control problems.
Solution: Implement Independent Quality Controls
The recommendation to help build a solid framework to lower contact rate within the South Florida region would be to immediately implement an independent quality control team. Ideally, this team would be developed from CAEs that demonstrate a strong knowledge of both billing and troubleshooting issues, common business processes, and an understanding of the relationship between customer satisfaction and the level of quality delivered through the interaction between the customer and the CAE.
While these findings recommend immediately deploying a “Care” quality control team, an optional approach and recommendation would be to implement a quality team that spans both care and techops/dispatch, as to ensure that quality is a commitment shared between both the customer facing technicians and the care organization. A joint quality control team would ideally bridge the two organizations further to allow communication to flow freely, identifying problems and potential solutions that would benefit both organizations provided both are committed to this type of partnership.
The development and deployment of a quality control team should be viewed beyond the standard “quality monitoring” activity. The team should be developed and deployed to:
- Continuously monitor live calls 24x7
- Provide live feedback to Supervisors and CAEs for distressed callers/CAEs
- Provide feedback to management and training on processes requiring clarification or re-enforcement, or for additional training emphasis with built in accountability for improvement.
- Provide both corrective action feedback and positive re-enforcement feedback to Supervisors & CAEs monitored
- Facilitate continued improvement and calibration sessions
- Intercept unnecessary truck rolls
- Identify escalations issues requiring supervisor interaction for “saves”
- Identify call drivers behind volume spikes, with real-time communication back to management. Data used for floor communications.
- Provide feedback to management for call-routing anomalies
This recommendation does not replace the CQE / OCI tools; nor is CQE / OCI a sufficient effort to address instituting a quality management system designed to impact contact rate. The above recommendation requires a new level of commitment and investment to ensure that consistent business processes are being applied through the delivery of our services. Phase I Project.
IVR Audit
Finding: Low IVR Utilization and Call Routing Opportunities
The initial 2 week review did not include heavy focus on an IVR audit, however observations from the national team, division and the local management team indicate that an IVR audit with a re-design and feature enhancements is warranted. Issues already identified include allowing customers to drop through menus, resulting in large “General” volumes, ineffective VIP routing process, and opportunities to deliver improved messaging and in-queue routing options.
Solution: IVR Audit
Several immediate IVR changes are being introduced with the Avaya call routing standardization, including:
- Removing the ability to drop through menus with no selection
- CTI validation changes to allow both entered phone number and captured ANI to route
- Removing Sales and Billing LOB menus
- Adjusting time-out variables
- Global Message changes and in-queue messaging
These changes are primarily driven from the Avaya call-routing standardization. Following the completion of the Avaya routing, Division will conduct an Empirix IVR Audit, Spanish language audit, review previous West audit and analyze investments required to implement additional self-service options in the current IVR. Phase III Project
Escalation Process
Finding: Escalation Process Enhancement Opportunity
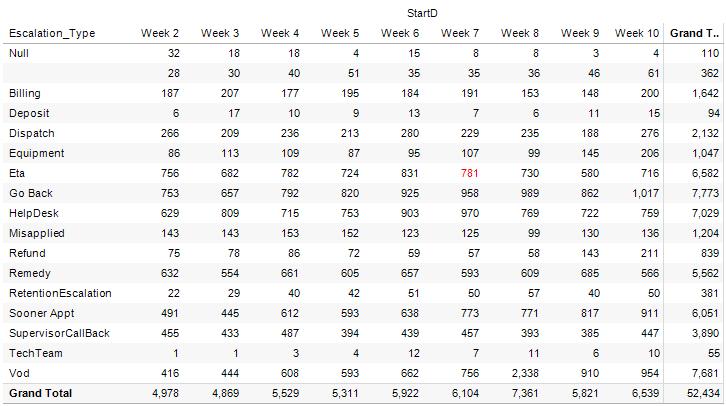
Miramar has developed a ticket tracking tool, “Resolve”, to help capture issues driving calls, and route common troubles directly to dispatch. Care has made progress in gaining service level commitments from dispatch to work tickets in a timely fashion. The Resolve ticketing database provides a solid source of ticket details, allowing analysis to be conducted on events driving traffic. With the Resolve ticket process, we have a foundation for documenting ETA requests, Go-Backs and other types of escalations:

While the data provided is valuable in determining what types of issues are driving call volume, the tool itself does not deliver a true escalation path, nor allow the customer to receive visibility on the status of their request.
Solution: Escalation Process Enhancement Opportunity
To reduce contact rate, the resolve tool’s data could be leverage to better inform the customer of the current status of their situation by interfacing with an email, web or SMS component. While the process has a service level component built-in, an opportunity also exists to allow tickets to re-escalate, or to permit a live-escalation on tickets which fall outside of service level. In conjunction with the current rules of engagement for processing resolve tickets, a full escalation path should be mapped allowing a customer, CAE or Supervisor a true escalation path. The Resolve tool also provides a data source for quality checks, to ensure that tickets are being opened correctly, with accurate and consistent data being supplied by CAEs. This is a Phase III project recommendation, to be evaluated in depth after phase I & II are complete.
Field Quality
Finding: Field Quality Driving Volume
All observations and studies suggest that quality issues within the plant exist that are directly related to increased call volume. This is supported through VOD trouble volumes, large volumes of customers calling repeatedly complaining of tiling issues and a high volume of callers that continually refer to how company “fixes the problem for a few weeks, then service just starts developing problems again”. Volumes of Resolve tickets analyzed show 12.5% of escalations over a 9 week period were “where’s my tech” calls, approximately 5-6k per month. This compares to Atlanta’s ticketing approximately 3.5-4k per month, on 500k more RGUs. “Go Back” requests were a full 15% of escalations over the same sample period. Other business processes, such as requests for earlier time frames (3-4k/mo) and IVR cancelled appointments appear to drive a higher volume of tickets than was witnessed in previous Atlanta studies.
Solutions
The ADS rollout is complete for Broward and 49k boxes remain for Dade. Additionally, the recent VOD system replacement has understandably resulted in call creation in the short term. Both systems have implemented the Refer to Maintenance process, allowing visibility be CAEs of any open service ticket.
Next Job/ETA: The “Where’s My Tech” volume can be addressed with improved technician coding of ETAs on their handhelds. (Dade is in the mid 60% and Broward is in the 40% range on ETAs daily). For installation work, however, the contractors are not using WFX. Contract labor strategy should address this issue.
'Pre-Repair Calls:' The recommendation has been made to utilize Universal Electronics Active Support Center to make outbound pre-repair calls. In addition to accumulating useable data on avoidable trouble calls which can be used for CAE coaching and trouble shooting training, UEI will resolve service calls by phone, resulting in an 18-20% reduction is truck rolls while the implementation of the various other projects noted here can be deployed.
Go Back Policy: It is recommended that Broward and Dade agree to implement a standard “Go Back” policy. For example – customers who missed their earlier appointment who call back in by 3PM will be worked up until 7 PM. Calls coming in after 3PM must be scheduled to the next available appointment. The call center team could then script consistent messages for any location and a clear expectation can also be set at the time an appointment is made. “Your appointment for tomorrow is scheduled between the hours of X and Y. Our team will call you 30 minutes in advance of your appointment to let you know that we are on our way. We need for you to be home, so please confirm that the number we will call is XXX-XXXX. It is important that someone be home when this call pre-call takes place, or finding no one home, our technician will have to move on to his or her next job.”
Cross-Department Communications: The call center and fulfillment organizations reside in independent silos and do not view theirs as a partnership. Ideas should be explored that build bridges between the two organizations which facilitate real-time communication flow that allows the customer to be better served.
Launch of Minuteman Activation Phase 1.0: In-house technicians will be provided the device health check and improved equipment activation flow through. Continued improvement in all technician’s equipment provisioning via their Symbol device (snapshot is 16% in Dade and 19% in Broward) will free dispatch time for other business process improvements.


